|
|
TECHNICAL ANALYSIS |
HOME |
|
|
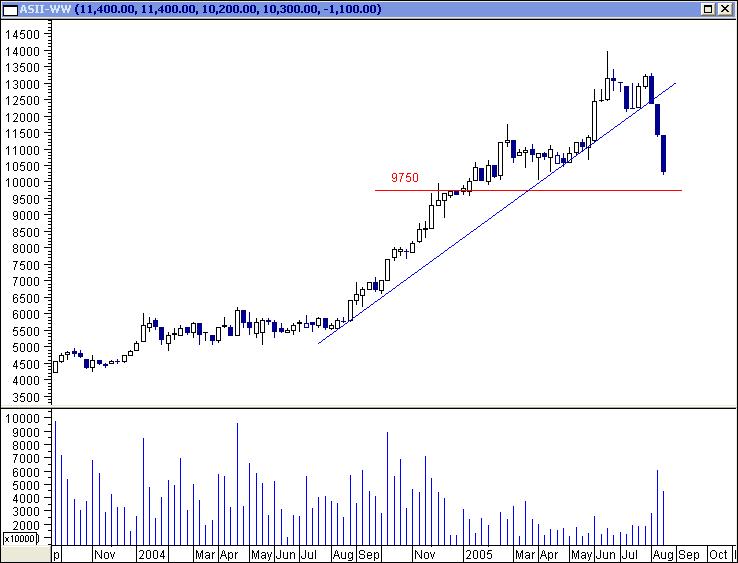
ASII (Astra International Tbk) Weekly Chart
|
Updated on 19/aug/05 |
|
|
|
|
| |
| |
In daily chart (not included in this web site),it
looks like the 3 weeks decline is near bottom and could construct
an early rebound pattern. This rebound area probably will emerge
near 9750. The time is near to cover short.
|
|
|
| |
| |
If you like to share something from your technical viewpoints with
me, you may send them to: mikerumawas@free.fr |
|
|
| |
Disclaimer: All of the information in this page and/or through all
pages in this web site are based on my personal judgement and viewpoints,
none of them is suggested for any visitors' or readers' investment
decision. |
|
|
|
HOME |
|
|